
 321-236-2899
Google Ads Quality Score: The Metrics That Actually Impact Your CPC
Most advertisers treat Google Ads Quality Score as a vanity number they glance at once a quarter. That instinct quietly costs them money on every single click.
This guide breaks down the three metrics that actually move Quality Score, and shows you the exact order to fix them. You’ll learn how a keyword that jumps from a 5 to an 8 can cut its cost per click by more than a third without touching your bids.
By the end, you’ll be able to open your account, spot which component is dragging a keyword down, and know precisely what to change first. This is the same discipline that separates efficient pay-per-click management from budget that quietly evaporates. Let’s start with what the score is really measuring.
Key Takeaways
- Quality Score is a 1–10 diagnostic built from three components: expected CTR, ad relevance, and landing page experience.
- A higher score directly lowers your CPC. Moving from an average 5 to an 8 can reduce cost per click by roughly 37%.
- Expected CTR carries the most weight, so tighter ad-to-keyword relevance is usually the fastest win.
- Landing page experience is the most ignored lever and often the one holding scores at 5 or 6.
- Quality Score compounds at scale — small per-keyword savings multiply across thousands of clicks a month.
- Fix components in order: diagnose first, then attack the weakest “Below average” flag before anything else.
What Google Ads Quality Score Actually Measures
Quality Score is a 1-to-10 diagnostic rating Google assigns to each keyword, estimating how relevant and useful your ad and landing page are compared to other advertisers. It is not a live input in the ad auction — it’s a report card that reveals where your account is leaking money.
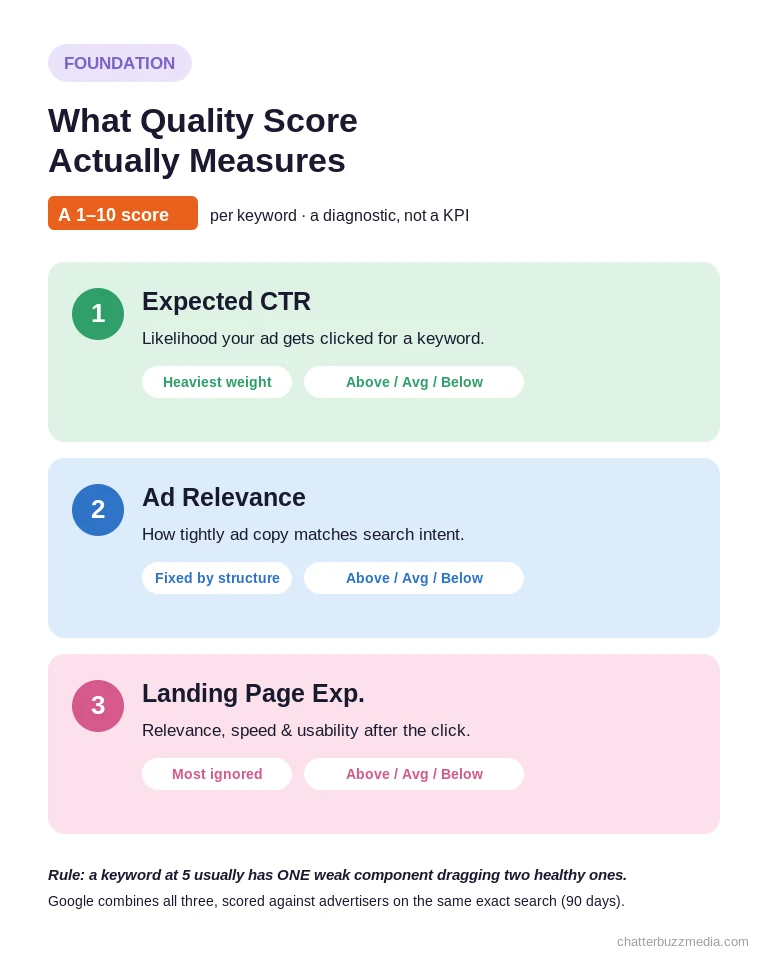
According to Google’s own documentation, the score is built from three components, each rated Above average, Average, or Below average. That comparison is based on the history of other advertisers who showed for the exact same search over the prior 90 days.
The three google ads quality score factors are straightforward once you name them clearly:
- Expected CTR: how likely someone is to click your ad when it shows for a given keyword.
- Ad relevance: how tightly your ad copy matches the intent behind the search.
- Landing page experience: how relevant, fast, and usable your page is after the click.
One nuance trips up even experienced marketers. Quality Score is calculated on historical impressions for exact searches of your keyword, which means switching match types alone won’t change it.
It also helps to know what Quality Score is not. Google is explicit that it’s a diagnostic tool, not a key performance indicator you should optimize toward or aggregate across campaigns.
In other words, chasing a perfect 10 on every keyword is the wrong goal. The score is a flashlight that points at broken relevance, and the real target is cheaper conversions, not a prettier number.
Understanding these three inputs is the whole game. Once you can read them, every optimization becomes obvious — and the first thing worth understanding is exactly how much money the score controls.
How Quality Score Impacts Your CPC
Your Quality Score directly discounts or inflates what you pay per click. Google effectively rewards relevance with cheaper traffic and penalizes weak ads by charging them more for the same position.
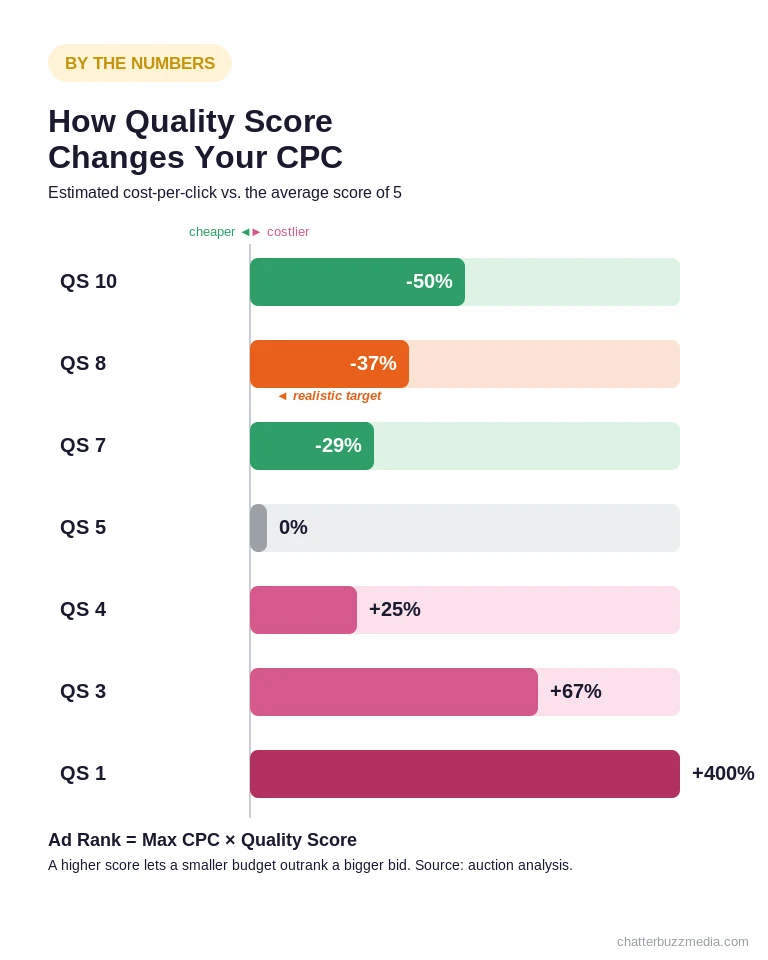
The mechanism runs through Ad Rank, which decides both whether your ad shows and where. The simplified formula is Ad Rank = Max CPC × Quality Score (plus the expected impact of your assets).
Because Quality Score multiplies your bid, a strong score lets you outrank competitors who bid more than you. The relationship to cost is dramatic when you map it out, as documented analyses of the auction show:
- A Quality Score of 10 can earn roughly a 50% discount on CPC versus the average.
- A score of 8 lands about a 37% discount — a realistic target for most accounts.
- A score of 4 or lower means you pay a premium, sometimes 25% to 400% more per click.
Now scale that. A 30% lower CPC on a keyword driving 3,000 clicks a month is not a rounding error — it’s budget you can redeploy into more conversions, the same efficiency logic behind weighing SEO versus PPC for any channel mix.
There’s a strategic angle too. Because a high score lets you win position without the highest bid, Quality Score is how a smaller advertiser beats a deeper-pocketed competitor in the same auction.
This is why Quality Score separates amateurs from professionals: the pros compound these savings across the whole account. With the stakes clear, the work starts with an honest diagnosis of where each keyword stands.
Step 1: Diagnose Your Three Quality Score Components
Before you fix anything, expose the component scores so you’re treating the actual problem, not guessing. A keyword sitting at 5 almost always has one weak factor dragging down two healthy ones.
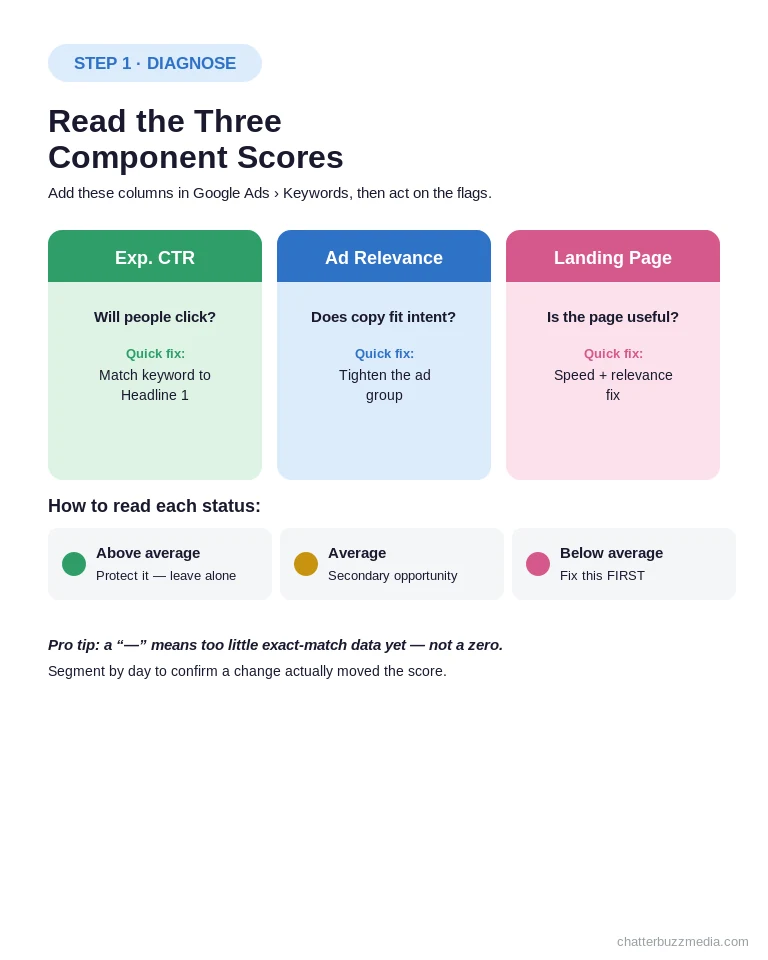
Inside Google Ads, open the Keywords tab, then use the columns icon to add four columns: Quality Score, Exp. CTR, Ad Relevance, and Landing Page Exp. This turns an abstract number into a clear map of what to fix.
Read the diagnosis like a mechanic reads a dashboard:
- Below average = your priority fix. This is the component costing you the most right now.
- Average = a secondary opportunity worth revisiting after the red flag is handled.
- Above average = leave it alone and protect it while you work elsewhere.
Add the historical Quality Score columns too, then segment by day. That lets you see whether a change actually moved the needle instead of trusting a single snapshot.
A “—” in the column simply means Google doesn’t yet have enough exact-match search data to rate the keyword. If your account is brand new, it also helps to understand how long Google Ads takes to work before expecting stable scores. With your weak component identified, you can attack the lever that usually returns the fastest gains: expected CTR.
Step 2: Fix Expected CTR, Your Biggest Lever
Expected CTR carries the heaviest weight of the three components, so improving it typically produces the largest Quality Score jump. Analyses that reverse-engineered the scoring, like this Search Engine Land breakdown, consistently rank it first.
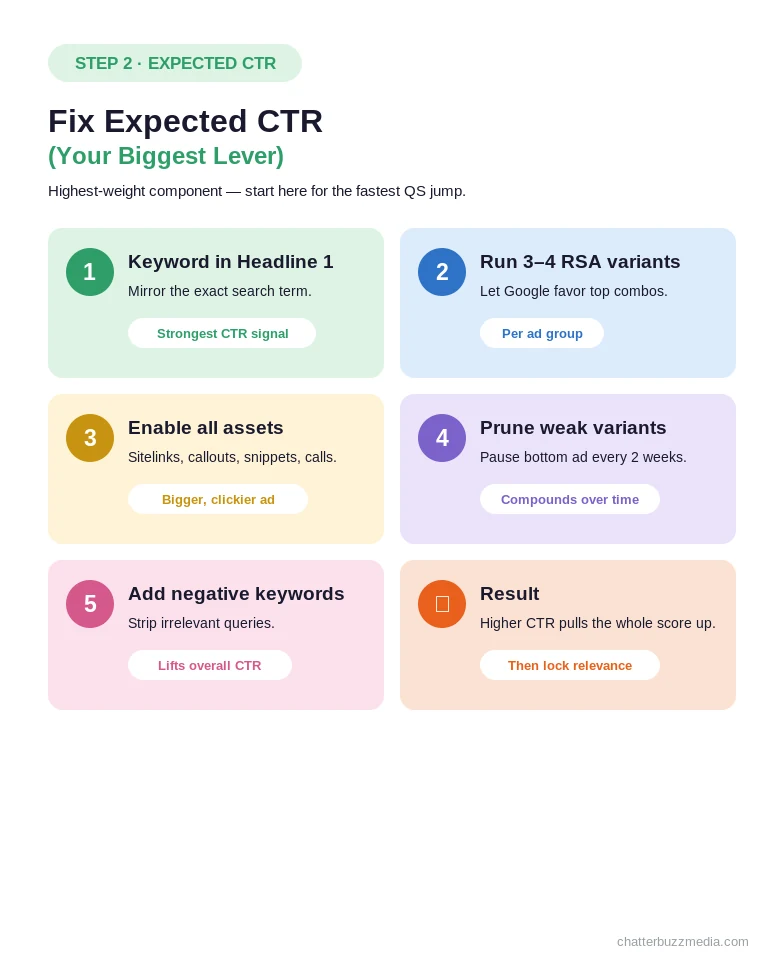
Expected CTR measures whether searchers want to click your ad — so the fix is making the ad genuinely more clickable for that specific query. This is where how to improve quality score becomes concrete work rather than theory.
Use these moves, roughly in order of impact:
- Put the exact keyword in Headline 1. A visible match between query and headline is the single strongest CTR signal.
- Run 3–4 responsive search ad variants per ad group so Google can favor the strongest combinations.
- Turn on every relevant asset type — sitelinks, callouts, structured snippets, and calls all expand your ad and lift clicks.
- Prune the weakest performers by pausing your bottom ad variant every couple of weeks.
- Add negative keywords to strip out irrelevant searches that quietly depress your click-through rate.
Each of these tightens the connection between what someone searched and what they see. Do them together and expected CTR climbs, pulling the overall score up with it.
One caution worth internalizing: expected CTR is judged against your ad’s own history for exact searches, so it rewards consistency. A brand-new ad starts with a neutral estimate and earns its rating as impressions accumulate, which is why patience beats constant rewrites.
Higher expected CTR is the foundation, but it only holds if the ad itself reads as relevant — which is the next component to lock down.
Step 3: Improve Ad Relevance With Tighter Ad Groups
Ad relevance measures how closely your copy matches search intent, and the root cause of a low score is almost always an ad group stuffed with too many mismatched keywords. The fix is structural, not clever copywriting.
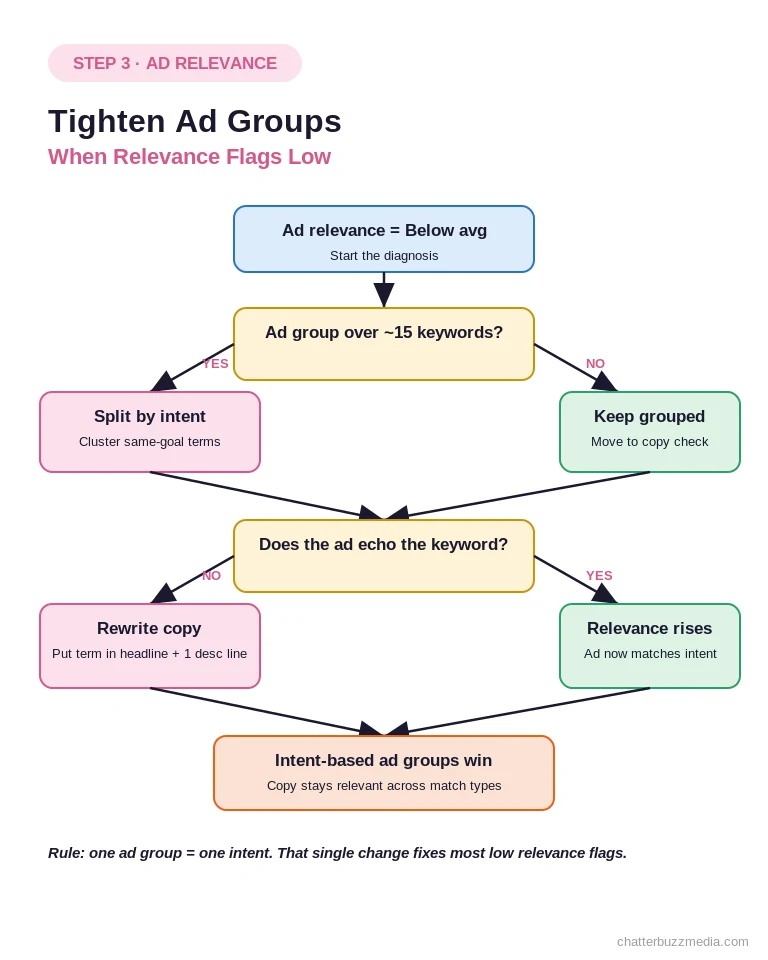
When one ad group holds 30 loosely related keywords, no single ad can speak to all of them, so relevance drops for every keyword at once. Splitting them into tightly themed groups lets each ad mirror its handful of keywords precisely.
Work through this decision path when relevance flags as Below average:
- Is the ad group over ~15 keywords? Break it into intent-based clusters that share the same goal.
- Do the keywords share one intent? Group “pricing” terms together and “how-to” terms separately so the ad can match.
- Does the ad echo the keyword? Rewrite headlines and at least one description line to include the core term or a close variant.
This is the practical difference behind quality score google ads gains that stick. Intent-based ad groups keep copy relevant even as match types pull in new query variations.
Tighter structure lifts ad relevance and reinforces the CTR gains from the last step. But both components send traffic somewhere — and Google is watching what happens after the click.
Step 4: Upgrade Your Landing Page Experience
Landing page experience is the most neglected component and the one most likely to cap your score at 5 or 6. Google evaluates relevance, speed, mobile usability, and how easily visitors can navigate once they arrive.
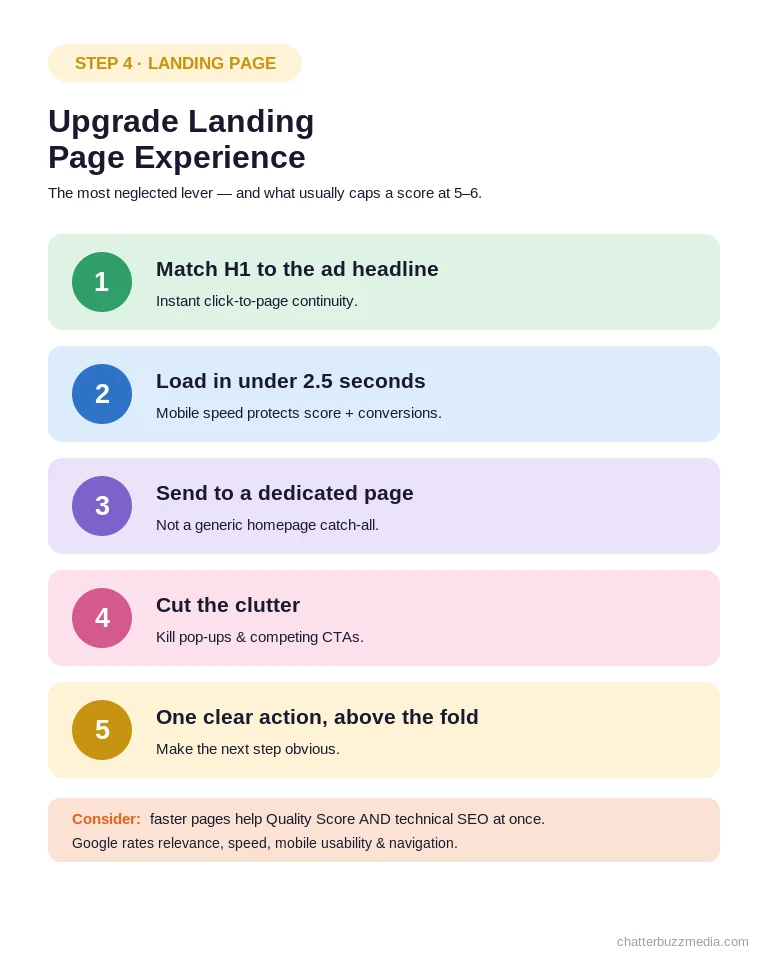
The most common mistake is sending paid traffic to a generic homepage instead of a page built around the ad’s promise. If someone searches for a specific service, the page they land on should be about that exact service — not a catch-all overview, a principle covered in these landing page elements that convert.
Prioritize these fixes, since they map directly to what Google measures:
- Match the page H1 to the ad headline so the visitor instantly sees continuity between click and page.
- Get load time under 2.5 seconds, especially on mobile, where slow pages quietly bleed conversions and scores.
- Cut the clutter — pop-ups, interstitials, and competing calls to action all degrade the experience Google rates.
- Make the next step obvious with a single, clear conversion action above the fold, the core job of conversion rate optimization.
These same fixes lift expected ctr downstream too, because pages that convert tend to earn better engagement signals. Speed work in particular pays double, improving both Quality Score and technical SEO health.
Dedicated pages built for paid traffic consistently outperform repurposed organic pages, a gap explored in depth in this guide to PPC landing pages. With all three components addressed, the final step is making sure they stay strong.
Step 5: Build a Quality Score Monitoring Routine
Quality Score is a moving target, so treat it as a habit rather than a one-time cleanup. Competitors change their ads, Google recalibrates against fresh 90-day windows, and scores drift if you stop paying attention.
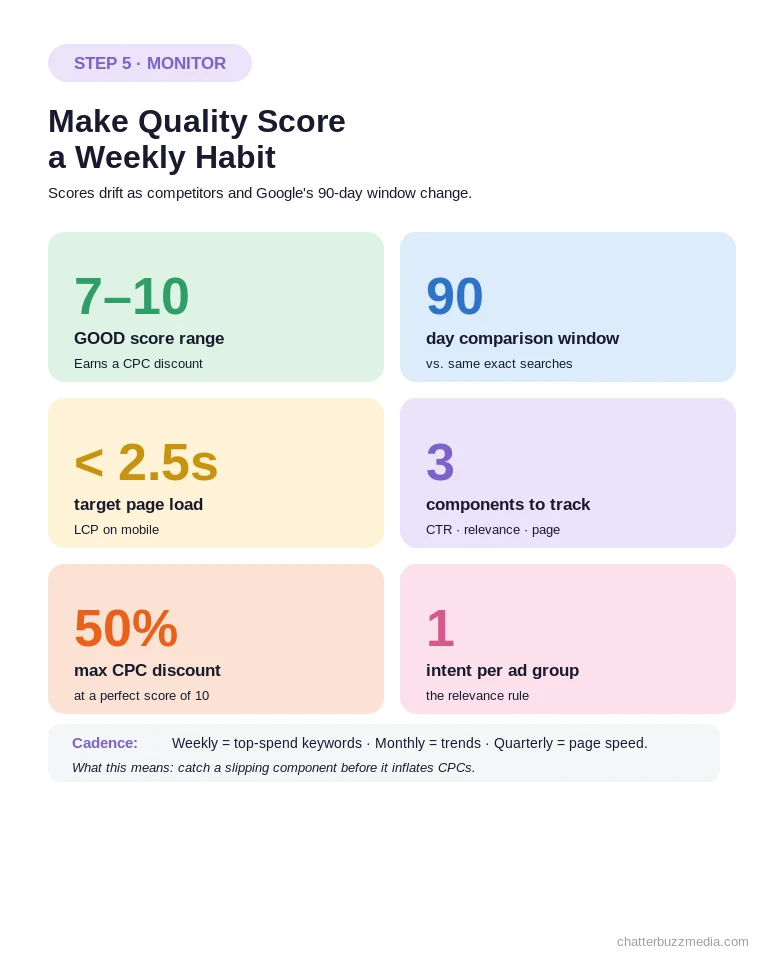
Set a simple cadence that catches problems before they compound. The goal is to spot a slipping component while it’s still an easy fix, not after it has inflated your CPCs for a month.
A workable monitoring rhythm looks like this:
- Weekly: scan your highest-spend keywords for any component that dropped to Below average.
- Monthly: review account-level trends, since a history of strong scores earns new keywords a better starting point.
- Quarterly: audit landing pages for speed regressions and outdated messaging.
Remember that Google also factors in signals outside the visible score, including device, location, and time of day. That’s why two accounts with identical setups can still see different results across regions — a reality that shapes paid search in regulated verticals like financial services and healthcare, where relevance is scrutinized even harder.
It also pays to log scores over time rather than trusting today’s snapshot. A simple spreadsheet or an automated script that records each keyword’s daily score turns Quality Score from a lagging indicator into an early-warning system.
Consistent monitoring keeps your hard-won gains from eroding and turns Quality Score into a durable cost advantage. That discipline is what compounds savings across an entire account over time.
Frequently Asked Questions
1. 🔍 What is a good Google Ads Quality Score?
A score of 7 to 10 is considered good and usually earns a CPC discount. A 5 or 6 is average and typically has one weak component, while 4 or below means you’re paying a premium and should prioritize fixes.
2. 📊 How is Google Ads Quality Score calculated?
It combines three components — expected CTR, ad relevance, and landing page experience — each rated against other advertisers who showed for the same exact search over the past 90 days. Expected CTR generally carries the most weight.
3. ⚡ How quickly can I improve my Quality Score?
Structural fixes like tighter ad groups and keyword-matched headlines can show movement within days once keywords gather fresh impressions. Landing page and CTR improvements often take a few weeks to fully reflect because the score is based on historical data.
4. 🏦 Does Quality Score really lower my cost per click?
Yes. Because Ad Rank multiplies your bid by Quality Score, a higher score lets you hold position while paying less, with top scores earning roughly a 50% CPC discount versus average.
5. 🤝 Does changing keyword match type affect Quality Score?
No. Quality Score is based on historical impressions for exact searches of your keyword, so switching between broad, phrase, and exact match doesn’t directly change it.
6. 💰 Which component should I fix first?
Fix whichever component is flagged Below average first, since that’s the one dragging your score down most. If several are weak, start with expected CTR because it carries the heaviest weight.
7. 🚀 Is Quality Score used in Performance Max and Shopping?
A quality signal still influences CPC and Ad Rank in those campaign types, but Google doesn’t display a keyword-level score. For Performance Max, relevance is driven by how well your asset groups match your audience.
8. 📈 Why is my Quality Score showing a dash?
A “—” means Google doesn’t have enough exact-match search data yet to rate the keyword. As soon as it collects sufficient impressions, a real score will appear.
Turning Quality Score Into a Cost Advantage
Quality Score isn’t a vanity metric — it’s a diagnostic that tells you exactly where your paid search account is overpaying. Read the three components correctly and every optimization becomes a direct line to a lower CPC.
Here’s your action plan:
- Diagnose first. Add the component columns and find each keyword’s Below average flag.
- Fix expected CTR. Match headlines to keywords, run multiple RSA variants, and enable your assets.
- Tighten ad groups around shared intent so ad relevance climbs.
- Upgrade landing pages for relevance, speed, and a single clear action, then monitor on a weekly cadence.
Work these in order and the savings compound across every keyword you run. For a broader tune-up of your paid search account, explore our Google Ads best practices guide, dig into how PPC and conversion optimization work together, or browse the full library of marketing resources to stretch every dollar further.

Victoria Wallace
Victoria Wallace is a senior content strategist and marketing writer with 30+ years of experience helping more than 200 brands translate complex business goals into clear, conversion-focused content. Her background spans paid media, marketing strategy, go-to-market planning, brand positioning, and full-funnel campaign development, giving her a deep understanding of how SEO content connects to real business growth.