
 321-236-2899
Marketing Budget Allocation: How to Split Your Spend Across Channels in 2026

Most marketing budgets are not underfunded. They are misallocated — spread across channels by habit, last year’s spreadsheet, or whoever argued loudest in the planning meeting.
Over the past decade, we have helped mid-market companies rebuild budgets that were quietly bleeding money into channels that only looked like they were working. The pattern repeats across credit unions, manufacturers, med spas, and B2B SaaS: the total spend was fine, but the split was wrong.
This guide walks you through exactly how to allocate a marketing budget across channels in 2026 — step by step, with real percentage splits by funnel stage and by industry. By the end, you will know how to set your total, divide it by channel, and reserve the right amount for testing so your plan survives contact with the real world.
Let’s start with the number that anchors everything else.
Key Takeaways
- Set your total first: Marketing budgets average 7.7% of company revenue in 2025, but B2B services run leaner (6.9%) and B2C services run richer (11.8%).
- Split by funnel before channel: A balanced starting point is 20% awareness, 30% consideration, 50% conversion — then adjust for sales-cycle length.
- Use the 70-20-10 rule: Put 70% into proven channels, 20% into scaling bets, and 10% into pure experiments.
- Adjust by industry: A manufacturer and a med spa should never run the same channel mix — vertical changes everything.
- Reserve for reallocation: Top performers hold back roughly 18% for mid-year shifts and invest 3× more in attribution than laggards.
Step 1: Set Your Total Budget as a Percentage of Revenue
Start by anchoring your total marketing budget to a percentage of gross revenue, then adjust up or down based on your growth stage. This single number sets the ceiling for every channel decision that follows, so getting it roughly right matters more than getting any individual channel perfect.
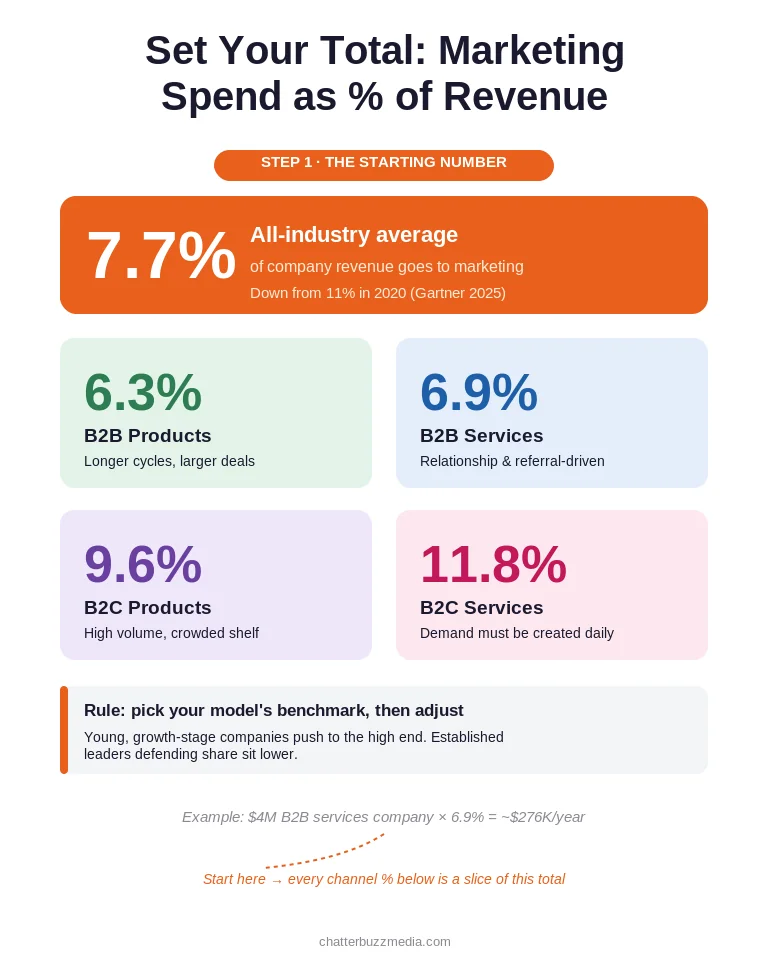
The benchmarks give you a defensible starting range. According to the Gartner 2025 CMO Spend Survey, marketing budgets now sit at 7.7% of company revenue on average — down from 11% in 2020.
Industry and business model move that number a lot. The U.S. Small Business Administration reports meaningfully different averages by type:
- B2B products: 6.3% of revenue — longer cycles, fewer but larger deals.
- B2B services: 6.9% of revenue — relationship-driven, referral-heavy.
- B2C products: 9.6% of revenue — higher volume, more competitive shelf space.
- B2C services: 11.8% of revenue — the highest, because demand must be created continuously.
Your growth stage is the second dial. A young company fighting for awareness should push toward the high end of its range, while an established leader defending share can sit lower.
Think about it the way a CFO would: marketing is an investment with a payback period, not a monthly cost to minimize. If your sales cycle runs three months to a year, this year’s budget is buying next year’s pipeline. For a fuller model on this, our guide on how much to invest in marketing breaks down the math by revenue stage.
Here is the calculation in practice. Say a B2B services company earned $4 million in gross revenue last year and wants moderate growth.
Applying the 6.9% B2B services benchmark gives a total marketing budget of roughly $276,000 for the year, or about $23,000 per month. If that same company were in a land-grab phase chasing a new market, pushing to 10% would justify closer to $400,000.
Notice what that range does: it turns an anxious guess into a defensible decision you can walk into a board meeting with. From here, every channel percentage in the steps below is a slice of that total — which is why setting it correctly first saves you from re-planning later.
Once you have the total, resist the urge to jump straight to channels. The next step keeps you from over-funding the bottom of the funnel.
Step 2: Divide the Budget by Funnel Stage Before You Pick Channels
Before allocating a single dollar to a channel, split your budget across the three funnel stages: awareness, consideration, and conversion. This step prevents the most expensive mistake in budgeting — pouring money into bottom-of-funnel channels that harvest demand while starving the top-of-funnel activity that creates it.
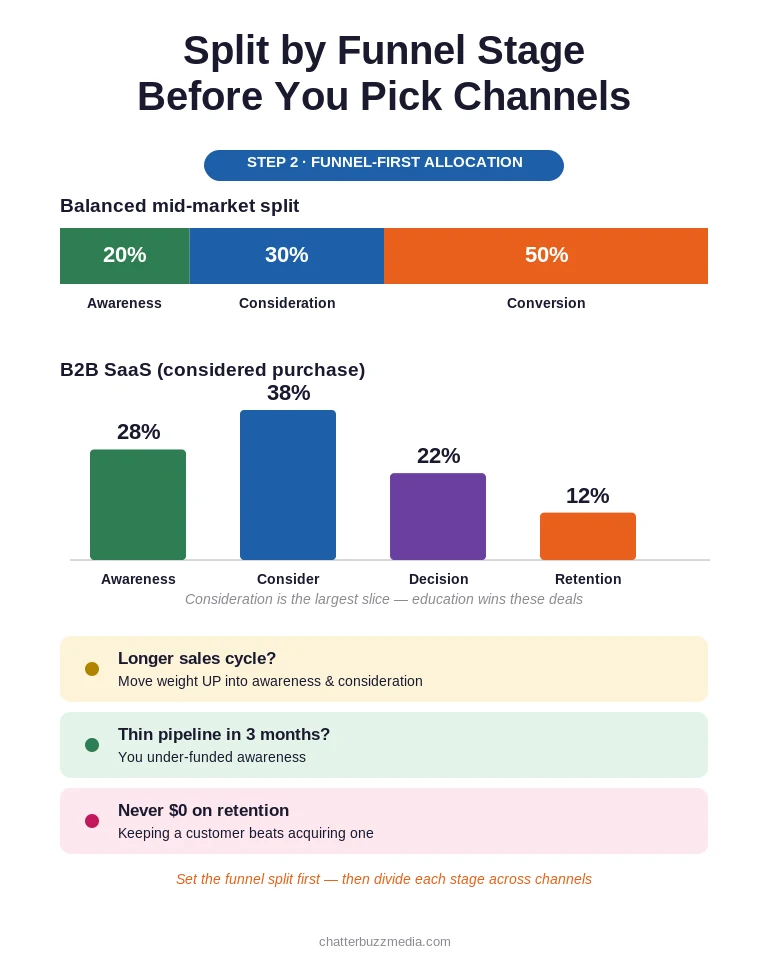
A common and defensible starting split is 20% awareness, 30% consideration, 50% conversion. It balances pipeline building against revenue capture for a typical mid-market company.
But the right split depends heavily on your sales cycle. Longer cycles need more awareness and consideration investment because prospects take months to decide, and they need to be nurtured the whole way through.
For B2B SaaS with a considered purchase, the data supports a heavier top and middle:
- Awareness: 28% — getting into the consideration set early.
- Consideration: 38% — the largest slice, because education wins these deals.
- Decision: 22% — closing demand you already created.
- Retention: 12% — expansion and renewal, which too many teams forget to fund.
The retention line is where most budgets are silently incomplete. Acquiring a new customer costs far more than keeping one, so a stage with zero budget is a leak, not a savings.
To set your own funnel split, start from your sales cycle length. The longer and more considered the purchase, the more weight moves up the funnel into awareness and consideration — because you are funding months of nurture, not a same-day decision.
A quick way to pressure-test it: if your pipeline is thin three months out, you under-funded awareness. If leads are plentiful but stalling, you under-funded consideration and enablement. Understanding the difference between the two is exactly why we separate demand generation from lead generation when we plan.
If your funnel and revenue stages feel fuzzy, our breakdown of go-to-market strategy by revenue stage maps spending priorities to where your company actually is. With the funnel split set, you can finally divide the money across channels.
Step 3: Split Across Channels With the 70-20-10 Rule
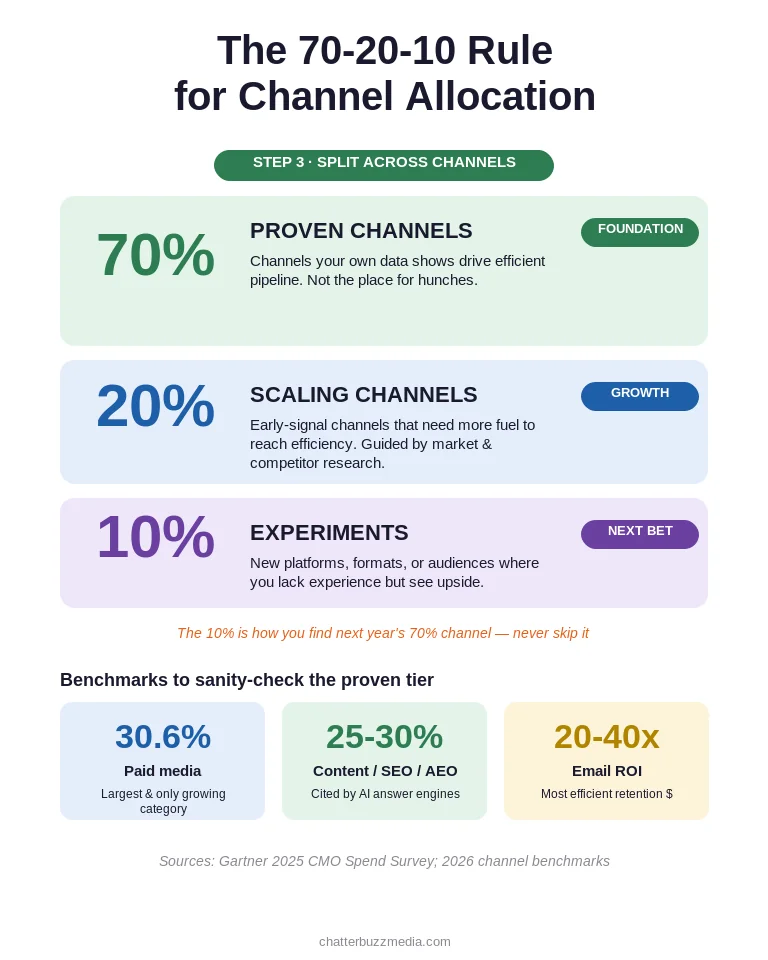
Allocate 70% of your channel budget to proven performers, 20% to promising channels you are still scaling, and 10% to pure experiments. The 70-20-10 rule keeps you disciplined about what already works while forcing a small, deliberate bet on what might work next.
Here is how each tier earns its place:
- 70% — Proven channels: The ones your own data shows drive efficient pipeline. This is not the place for hunches.
- 20% — Scaling channels: Channels showing early signal that need more fuel to reach efficiency, guided by market and competitor research.
- 10% — Experiments: New platforms, formats, or audiences where you lack experience but see upside.
The mistake to avoid is treating that 10% as optional. The experimental tier is how you find next year’s 70% channel before your competitors do.
Within the proven tier, channel-level benchmarks help you sanity-check the split. Recent data shows a few consistent patterns worth knowing:
- Paid media has grown to roughly 30.6% of total marketing budgets — the single largest category and the only one growing over five years, per Gartner.
- Content, SEO, and AEO command 25–30% of successful 2026 budgets, reflecting the shift toward being cited by AI answer engines.
- Email marketing still returns 20:1 to 40:1, making it the most efficient retention channel dollar for dollar.
To make this concrete, here is one way a mid-market B2B company might split the proven 70% tier across channels — before layering in the 20% scaling and 10% experimental tiers:
- Paid search & paid social: ~35% of the channel budget, capturing high-intent demand and retargeting warm audiences.
- Content, SEO & AEO: ~25%, building the organic authority that lowers paid costs over time.
- Email & marketing automation: ~10%, the efficiency engine for nurture and retention. Our guide to marketing automation shows how to scale this without adding headcount.
That leaves the scaling and experimental tiers for the channels you are still proving out. If AI-driven search is new to you, the reason content share keeps climbing is covered in our look at SEO practices for 2026. Benchmarks are a starting point, though — the next step adjusts them for your specific industry.
Step 4: Adjust Your Channel Mix by Industry
Take your benchmark channel split and reshape it around how your industry’s buyers actually make decisions. A manufacturer’s buyer researches for months on search and LinkedIn, while a med spa’s client books on impulse from Instagram — the same generic mix would fail both.
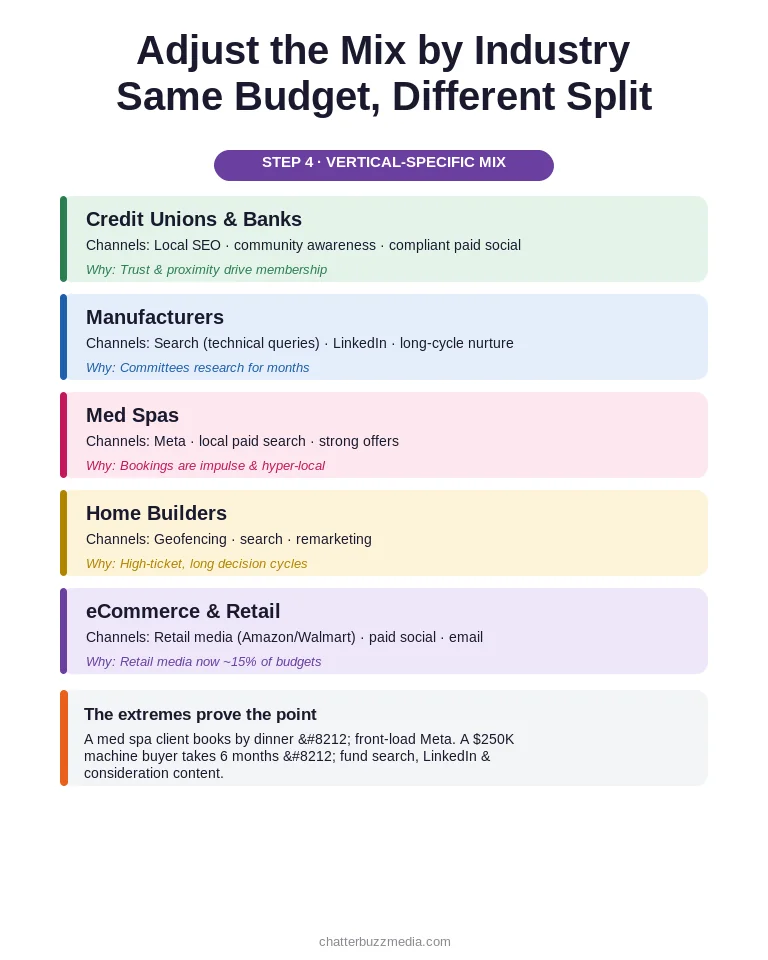
Here is how real allocation decisions differ across the verticals we work in most. Treat these as informed starting points, not gospel:
- Credit unions & banks: Heavy on local SEO, community awareness, and compliant paid social; lighter on aggressive discount-driven ads. Trust and proximity drive membership. See our credit union marketing approach for the compliance nuances.
- Manufacturers & industrial: Weighted toward search (high-intent technical queries), LinkedIn, and long-cycle nurture. Buying committees research for months, so manufacturing marketing favors consideration-stage content.
- Med spas & aesthetics: Front-loaded on Meta and local paid search with strong offers, because bookings are impulse-driven and hyper-local. Our med spa marketing guide details the geo-targeting play.
- Home builders: A blend of geofencing, search, and remarketing tied to long, high-ticket decision cycles. Home builder marketing lives and dies on remarketing.
- eCommerce & retail: Increasingly shaped by retail media — Amazon, Walmart Connect, and Instacart now absorb about 15% of eCommerce budgets. eCommerce marketing has to account for that shift.
The contrast is sharpest at the extremes. A med spa might put the majority of its budget into Meta and local search because a prospect can see an ad at lunch and book by dinner. A manufacturer selling a $250,000 machine cannot buy its way to a same-day decision, so it shifts that same money into search, LinkedIn, and consideration-stage content that earns trust across a six-month evaluation.
The through-line is simple: allocate to the channels where your buyers already spend attention, not the channels that are easiest to report on. If you are not sure where that attention lives, building a buyer persona first is the fastest way to find out, as we cover in our B2B buyer persona guide.
No matter how good your split is on day one, it will drift. The next step builds in the flexibility to fix that.
Step 5: Reserve Budget for Testing and Mid-Year Reallocation
Hold back roughly 15–18% of your budget as a reallocation reserve rather than committing 100% up front. The single biggest allocation mistake is not the initial split — it is treating that split as permanent while markets, algorithms, and seasonality shift underneath it.
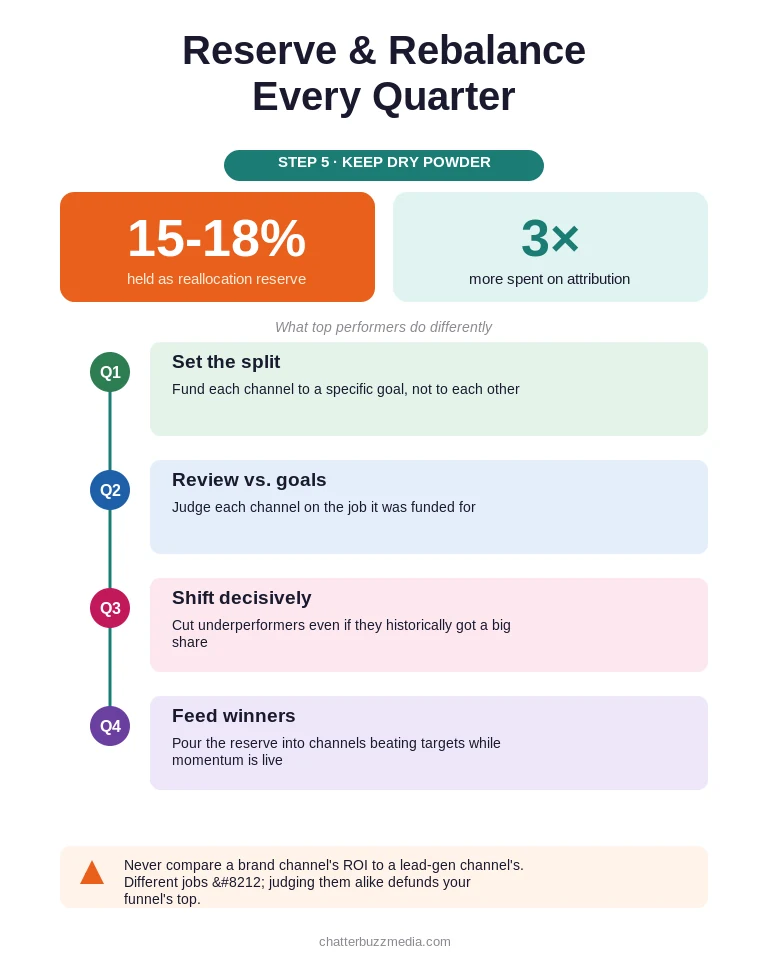
Top-performing teams do two things differently. They reserve about 18% for mid-year reallocation, and they invest roughly 3× more in attribution tools than low performers — because you cannot reallocate intelligently if you cannot measure honestly.
Build a quarterly rebalancing rhythm so the reserve actually gets used:
- Every quarter: Review channel-level performance against the goals each channel was funded to hit — not against each other.
- Shift decisively: Move budget away from underperformers, even ones that historically got a big share.
- Feed winners: Pour the reserve into channels beating their targets while the momentum is live.
The reserve also protects you from seasonality and surprises. When a campaign unexpectedly takes off, you want dry powder ready to pour into it that week — not a locked plan that forces you to watch the window close.
One caution when you measure: do not compare a branding channel’s ROI against a lead-generation channel’s ROI. They were funded for different jobs, and judging them on the same metric quietly defunds the top of your funnel. The right move is to hold each channel accountable to the goal it was assigned, then let the reserve reward whichever ones clear their bar.
Track the right numbers and this becomes routine rather than political — our rundown of the marketing KPIs that actually matter gives you a clean scorecard. Even with a reserve in place, a few recurring traps can undo an otherwise smart plan.
Step 6: Avoid the Allocation Mistakes That Quietly Waste Spend
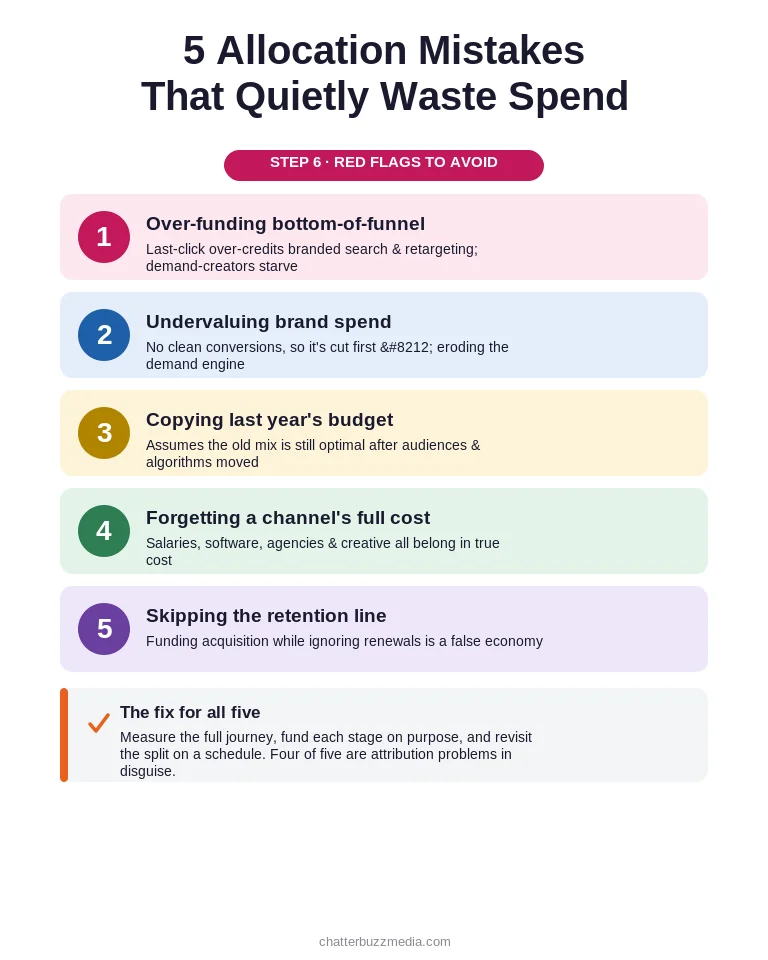
Most wasted budget traces back to five predictable mistakes, and every one of them is a measurement blind spot before it is a money problem. Knowing them in advance is the cheapest optimization you will ever make.
Watch for these five in your own plan:
- Over-investing in bottom-of-funnel channels: Last-click attribution over-credits branded search and retargeting, so budget floods to channels that capture demand while the ones that create it starve.
- Undervaluing brand spend: Brand campaigns rarely show clean, trackable conversions, so they get cut first — eroding the demand engine that feeds every performance channel.
- Letting last year’s budget dictate this year’s: Copying last year’s split assumes the channel mix is still optimal. It rarely is once audiences and algorithms move.
- Forgetting the full cost of a channel: Ad spend is only part of it — salaries, software, agencies, and creative production all belong in the channel’s true cost.
- Skipping the retention line: Funding acquisition while ignoring renewals and expansion is the most expensive false economy in the plan.
Notice that four of the five are attribution problems in disguise. That is why top performers invest so heavily in measurement — not because dashboards are fun, but because every allocation decision is only as good as the data behind it. Combining marketing mix modeling for the big picture with multi-touch attribution for tactical calls closes most of these blind spots.
The fix for all five is the same discipline: measure the full customer journey, fund each stage on purpose, and revisit the split on a schedule. If you want an outside read on where your current budget is leaking, a structured digital marketing audit will surface it fast — and if paid channels are the concern, our PPC management team can pressure-test the spend directly.
Frequently Asked Questions
1. 🔍 What percentage of revenue should go to marketing in 2026?
The 2025 average is about 7.7% of company revenue, but it varies widely by model — roughly 6.3% for B2B products, 6.9% for B2B services, 9.6% for B2C products, and 11.8% for B2C services. Younger companies chasing growth should push toward the high end of their range; established leaders defending share can sit lower.
2. 📊 How should I split my marketing budget across channels?
Start with the 70-20-10 rule: 70% to proven channels, 20% to promising ones you are scaling, and 10% to experiments. Then reshape that split around your funnel stages and your specific industry, because a generic mix rarely fits any real business.
3. ⚡ What is the 70-20-10 rule for marketing budgets?
It is a channel-allocation framework: put 70% of spend into channels your data proves work, 20% into channels showing early promise, and 10% into new bets where you lack experience. The 10% experimental tier is how you discover next year’s core channel before competitors do.
4. 🏦 Should I allocate more to paid or organic?
It depends on your timeline and goals. Paid media delivers faster, more controllable results and now makes up the largest single budget category, while organic content, SEO, and AEO build compounding authority and increasingly get you cited by AI answer engines. Most healthy budgets fund both, with the ratio set by how quickly you need pipeline.
5. 🤝 How much should I spend on brand versus performance marketing?
There is no universal ratio, but starve brand at your peril — it is the demand-creation engine that makes performance channels efficient. Use marketing mix modeling to quantify brand’s contribution at the aggregate level so it survives budget-cutting season instead of being the first line cut.
6. 💰 How often should I rebalance my marketing budget?
Review channel performance quarterly and hold back roughly 15–18% of the annual budget as a reallocation reserve. This lets you shift money toward what is working mid-year instead of locking in a split that made sense in January but not in July.
7. 🚀 How do I budget for a new product launch or new channel?
Fund launches from your awareness and consideration stages, and pull the initial spend from your 10% experimental tier plus the reallocation reserve. Give any new channel enough runway and a clear success metric before you judge it, since most need several months to reach efficiency.
8. 📈 What is the biggest marketing budget allocation mistake?
Treating the initial split as permanent. Markets shift, algorithms change, and seasonality moves — teams that never revisit their allocation slowly funnel money into channels that look effective under last-click attribution but are not actually driving growth.
Putting Your Allocation Plan Into Action
Marketing budget allocation is not about finding one perfect split — it is about setting a smart starting point and building in the discipline to correct course. Do that, and a flat budget can outperform a bigger one that is spread on autopilot.
The teams that win are not the ones with the biggest budgets. They are the ones who fund each stage of the journey deliberately, measure honestly, and move money toward proof the moment they see it.
Here is your four-step action plan:
- Set your total as a percentage of revenue using the benchmark for your model, adjusted for growth stage.
- Split by funnel stage first (a 20/30/50 starting point), then divide across channels with the 70-20-10 rule.
- Reshape the mix for your industry so spend follows where your buyers actually pay attention.
- Reserve 15–18% for reallocation and rebalance every quarter against each channel’s own goals.
If you would rather pressure-test your allocation with a second set of eyes, our fractional CMO guide shows how experienced operators make these calls — and our library of marketing strategy resources goes deeper on every channel above.
Need help with SEO? Explore our SEO agency services.

Victoria Wallace
Victoria Wallace is a senior content strategist and marketing writer with 30+ years of experience helping more than 200 brands translate complex business goals into clear, conversion-focused content. Her background spans paid media, marketing strategy, go-to-market planning, brand positioning, and full-funnel campaign development, giving her a deep understanding of how SEO content connects to real business growth.